Best Rated Answer Engine Optimization Tools in 2026 (8 AEO Tools)
The Peak Answer team · 11 min read
TL;DR: These are the 8 best rated answer engine optimization tools in 2026. An AEO tool tracks whether ChatGPT, Perplexity, Google and the other engines recommend your brand. The ones worth paying for show you the sources behind each answer, tell you whether an answer was retrieved or remembered, and help you act on what they find.
What is an AEO tool?
An AEO tool (answer engine optimization tool) measures what AI engines say about your brand and your niche, and shows you what to change. It goes by other names, like AEO software or an AEO platform. "GEO" (generative engine optimization) is basically the same thing, and everything here applies under either name.
What makes a good AEO tool
The criteria come first, before any product is named.
Real questions, not keywords. The input to an answer engine is a sentence, so a good AEO tool tracks questions.
Source-level reporting. Knowing you were not named tells you very little. Knowing which 4 pages the engine read tells you what to do.
The retrieval/memory split. Retrieved answers move with content and placement in weeks. Remembered answers move with presence over months. Most tools cannot tell you which one you are looking at.
Multiple engines. They disagree, often sharply. One engine is one data point.
Clarity on what it does not do. Several of these products report and stop, which is a fine design as long as they say so.
The 8 best rated AEO tools compared
| Tool | Best for | Engines | Entry price | Acts on findings |
|---|---|---|---|---|
| Peak Answer | measurement plus the work it implies | 6 | $49/mo | Content, placements, social, technical |
| Profound | enterprise reporting | 5+ | Quoted | No |
| Peec AI | daily single-brand tracking | 3 of 6 | $95/mo | No |
| Otterly | cheapest credible tracking | 4 | $29/mo | No |
| AthenaHQ | agencies and multi-brand | 5 | $295/mo | Partial |
| Scrunch AI | crawler and agent visibility | 5 | $300/mo | Technical only |
| Semrush AI Visibility | teams already on Semrush | 5 | $165.17/mo | Via Semrush |
| Writesonic | content production first | 4 | $49/mo | Content |
Prices checked 2 October 2026.
Pricing, in the unit you actually consume
Every vendor prices in a different unit - prompts, credits, queries, tracked keywords, brands - and none of them is the thing you buy. What you buy is model responses per month: questions times engines times frequency.
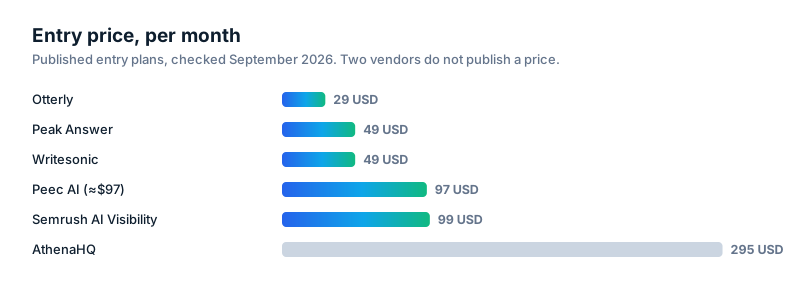
Converted, the ordering changes completely.
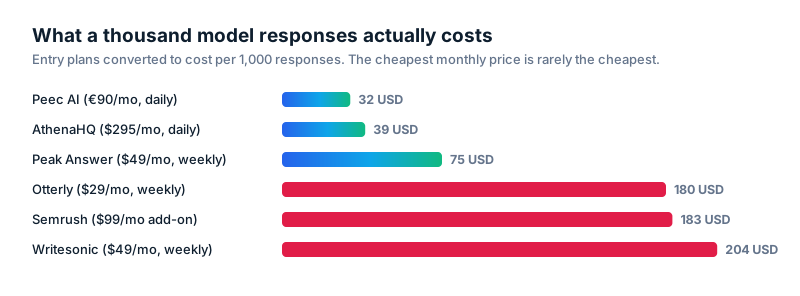
| Tool | Entry | Engines | Refresh | Responses/mo | Per 1,000 |
|---|---|---|---|---|---|
| Peec AI | $95/mo | 3 of 6 | Daily | 4,500 | $21 |
| Peak Answer | $49/mo | 6 | Weekly | 1,300 | $38 |
| AthenaHQ | $295/mo | 5 | Daily | ~7,500 | ~$39 |
| Otterly | $29/mo | 4 | Weekly | ~160 | ~$181 |
| Semrush | $165.17/mo | 5 | Weekly | ~540 | ~$306 |
| Writesonic | $79/mo | 4 | Weekly | ~240 | ~$329 |
Two rows carry no tilde because nothing in them is estimated. Peec publishes its answer count as well as its price, 4,500 a month on the $95 plan, and the Peak Answer row is ours. The rest multiply out the allowance each vendor states, which is why they are approximate: where a vendor publishes a prompt count but not an engine count or a refresh rate, part of the multiplication is a reading of their plan rather than a figure off their page.
Two things this makes visible. Daily refresh dominates the economics: Peec and AthenaHQ look expensive monthly and sit at the cheap end per response, because they measure seven times as often, which is only value if you will act seven times as often, and most teams will not. And the cheapest monthly price is the most expensive per unit: Otterly at $29 costs roughly eight times more per thousand responses than Peec at $95.
Note where that leaves us. Peak Answer is the second cheapest per response here, and about 1.8 times the cost of Peec on that measure. Per response Peec is the better buy, and the argument for Peak Answer is the column this table does not have, which is whether anything happens after the measurement.
Prices read off each vendor's own pricing page in 2 October 2026.
What each one does after it has measured
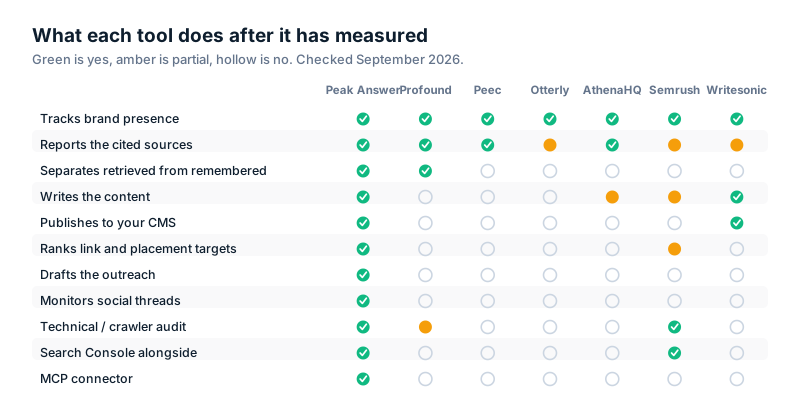
The rows that separate these products are the bottom seven, not the top two. Everything here tracks brand presence. The question is what happens next, and whether anybody at your end is going to do it if the product does not.
What the measurement actually says
Most writing in this category is advice. This section is the measurement behind it, and it is ours: fourteen markets measured end to end, and 505 tracking runs on our own category.
How winnable a market is varies more than anyone admits
We measured fourteen markets with the same engine the product runs for customers, scoring every domain the engines cited. The entry bar - how small a cited site can be and still get quoted - ranged from 12 to 66 out of 100.
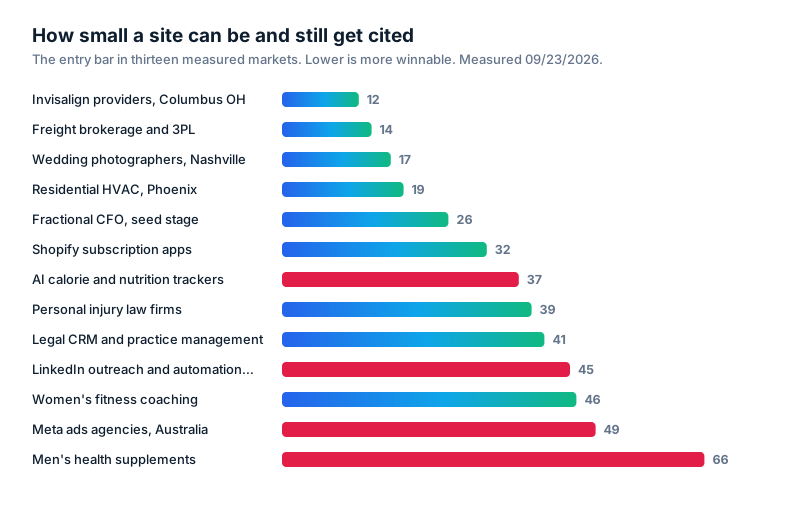
That is the difference between a quarter of work and a year of it, in the same discipline, decided entirely by which market you are in. Any vendor quoting one timeline has measured one market at most.
In Invisalign providers in a single city the bar was 12 and the typical cited site scored 25: a handful of well-made procedure and cost pages clears it. In men's health supplements the bar was 66 and GNC, a national retail chain, scored 62 and cleared it on one question in three, because the engines answer health questions out of medical sources and will not name a shop.
In most markets, your own site is not what gets cited
Content share is the proportion of cited sources that are somebody else's article rather than any vendor's own page. In ten of fourteen markets it was 80% or more.
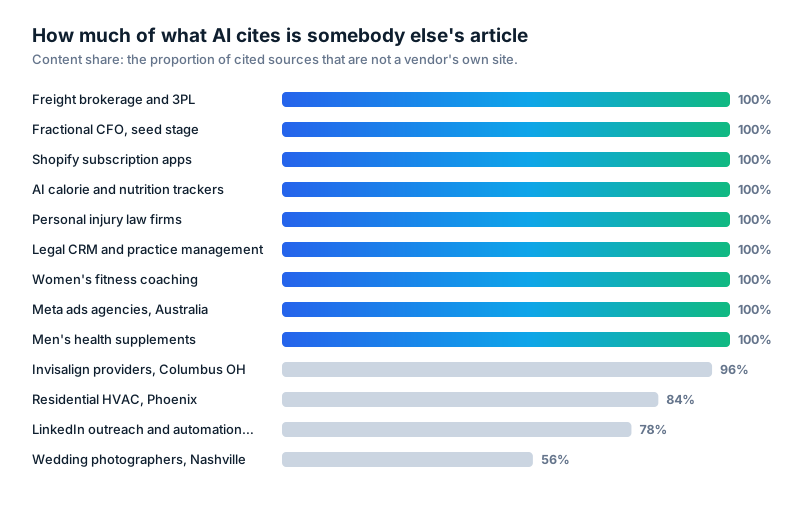
In those nine, publishing more of your own content cannot put you in the answer, because no vendor's own content is being cited at all. The mechanism is editorial: being named inside the pages that do get cited. The one outlier was wedding photography at 56%, where the answer to the question is a list of photographers and the engines cite their portfolios directly.
This is the single most useful thing to know before choosing a tool, and almost none of them will tell you, because almost none of them report at the source level.
The gap between the floor and the middle is where newcomers get in
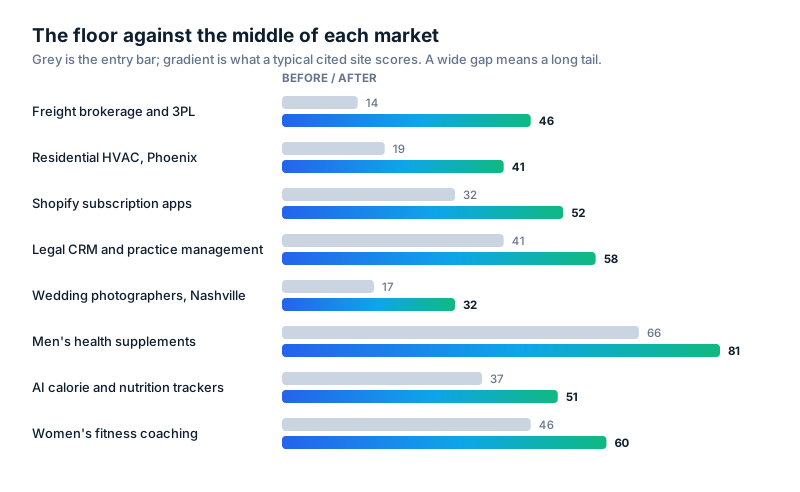
A wide gap means the engines are citing a few large publications and, underneath them, a scattering of much smaller sites. That tail is the opening. Freight brokerage had a bar of 14 against a median of 46, the widest spread we measured, and almost any serious page clears 14.
A narrow gap means the opposite. LinkedIn outreach tools had a bar of 45 against a median of 49 - four points - which means every cited site is roughly the same size and nothing small is getting in underneath.
We ran the same study on this category
505 tracking runs, 22 buying questions, every citation recorded and attributed to the question that produced it.
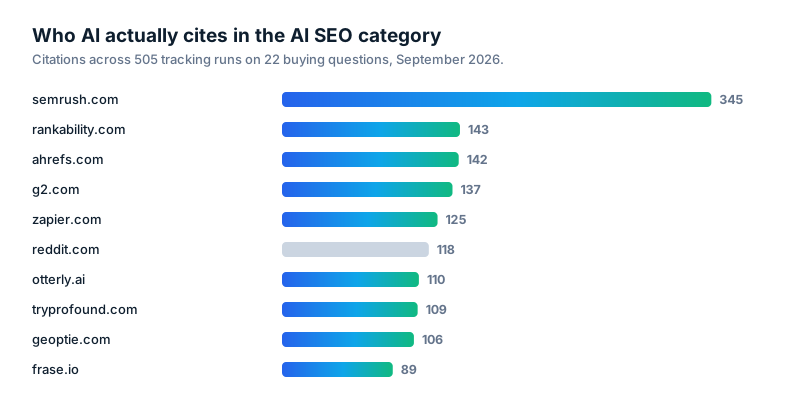
Two things fell out of it. Semrush at 345 citations is nearly two and a half times the next domain, and it is cited on use case, pricing and category questions rather than comparison ones: the engines reach for established publishers when the question is general. And Reddit at 118 citations is a top-ten source, which is the most actionable line on this page for a small company. You cannot become Semrush. You can answer a question in a thread.
The question type that quietly wastes a measurement budget
Six of our 22 questions were "alternatives to [competitor]". Those six produced most of the competitor citations in the whole study.
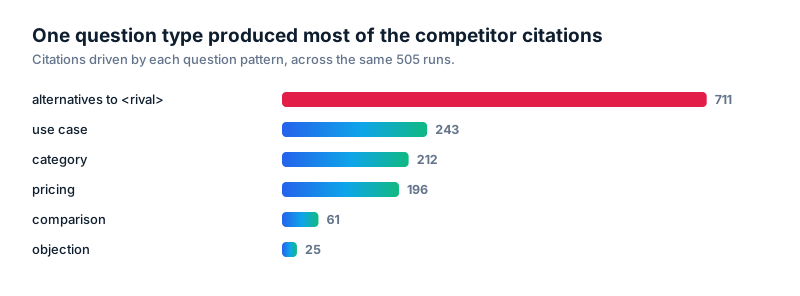
Obvious on reflection and we had not reflected on it: asking an engine to enumerate a competitor's alternatives returns competitors, cited from competitor comparison pages, none of which is a site you can get a link from. We cut that question type from six to two. The signal was worth having once; it was not worth a quarter of the budget every week.
If you are evaluating tools, this is worth checking in whatever you buy. Look at what your prompt set is made of, and look at what the citations come back as. A set made entirely of vendor-selection questions can only ever produce a citation list of vendors.
The one distinction that decides which work pays
Everything else on this page is detail. This is the thing to get right.
An AI engine answers in one of two ways, and they need opposite fixes.
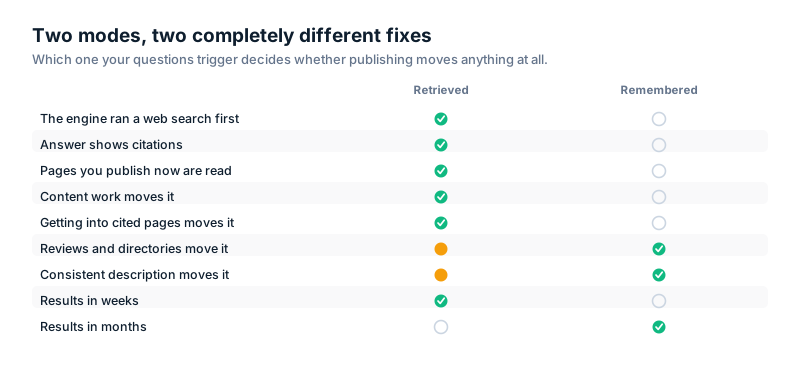
Retrieved. The engine ran a web search, read a handful of pages, and summarised them. Those pages decide the answer. Content and placement work, and they work in weeks, and a small company can win because the engine is summarising documents rather than ranking brands.
Remembered. The engine answered from training data that closed months ago. Nothing you publish this quarter will be read, because nothing is being read. Only breadth of presence moves it: reviews, directories, consistent description, over months.
Work on the wrong one and you get no result and no explanation, which is how a year disappears. So the question to ask any vendor is not how many engines they track. It is whether they will tell you, per question, which of these two you are facing.
Most of this category cannot. It is the row in the feature table worth more than the other fourteen put together.
Peak Answer
Peak Answer is an AEO tool that tracks 6 engines weekly, from $49/mo. It has source-level reporting, the retrieval/memory split per question, and Search Console alongside. Then it does the work: content against measured gaps pushed to your CMS as drafts, placements ranked by what the engines already cite with outreach drafted, social threads, and technical fixes.
It publishes its method, including fourteen markets measured.
Profound
An enterprise answer engine optimization tool, quoted pricing. It has the deepest analysis available and the most credible reporting for a sceptical internal audience. It does not act on findings.
Peec AI
$95/mo, daily, one brand, 3 of its 6 engines on the entry plan. Very simple to use.
Otterly
$29/mo, 4 engines, weekly. The cheapest credible AEO tool here.
AthenaHQ
$295/mo, multi-brand, client reporting, daily.
Scrunch AI
Scrunch AI looks at crawler and agent access, not brand presence. It answers the earlier question of whether engines can reach your site at all.
Semrush AI Visibility
$165.17/mo, inside the main plan. Good for context, less depth.
Writesonic
Content first, tracking attached.
AEO tool comparison on the criteria
| Real questions | Source reporting | Retrieval/memory | Engines | Acts | |
|---|---|---|---|---|---|
| Peak Answer | Yes | Yes | Yes | 6 | Yes |
| Profound | Yes | Yes | Yes | 5+ | No |
| Peec AI | Yes | Yes | No | 3 of 6 | No |
| Otterly | Yes | Limited | No | 4 | No |
| AthenaHQ | Yes | Yes | No | 5 | Partial |
| Scrunch AI | n/a | n/a | n/a | 5 | Technical |
| Semrush | Partial | Limited | No | 5 | Partial |
| Writesonic | Yes | Limited | No | 4 | Content |
How to choose
How to choose, whatever you pick
Convert every plan into responses per month. Questions × engines × frequency. Pricing in this category is quoted in prompts, credits and tracked keywords, and those are not the same unit. The cheapest headline price is frequently the most expensive per response.
Decide who acts. Most of these products report and stop. That is correct design if you have a content function. If you do not, a reporting subscription produces homework rather than results.
Check the two engines you care about, not the total count. Six is not better than five if your buyers use the five.
Ask to see raw captured answers, not a summary. An index you cannot audit is a number taken on faith, in a category too young to extend that.
Run two in parallel for a month. They will disagree on absolute numbers, which is expected. They should agree on direction and on which questions you lose, and that agreement is what you act on.
The category is young
Entry bars across the fourteen markets Peak Answer measured ranged from 12 to 66 out of 100, the difference between a quarter of work and a year of it. In one market the typical cited site scored 25 and a site scoring 8 was in the answer. Positions are still quite available right now.
Related guides
FAQs
It depends on what you need. Peak Answer is the one in this list that measures and then acts on the findings, from $49/mo. Profound suits enterprise reporting, and Otterly suits cheap tracking.
Otterly at $29/mo. Convert to cost per response before assuming cheapest means cheapest.
They overlap at the technical layer and diverge above it. Most teams end up with both, so Search Console integration is worth looking for.
The ones your buyers use. 4 well-chosen engines beat 6 badly chosen ones, and nobody's buyers use all of them.
For a one-off check, yes: ask the engines yourself. For anything continuous, no. The output varies between identical asks, so a single observation tells you very little about a rate.
Basically nothing in practice. GEO (generative engine optimization) is specific to generative models, and AEO also covers featured snippets and voice. It is the same work and the same tools.